고정 헤더 영역
상세 컨텐츠
본문 제목
미국 주식 뉴스 , Leading indicator index slips further in june for longest losing streak since
본문
반응형
Leading indicator index slips further in june for longest losing streak since 2007-08

미국 경제 선행 지수 예측
지수가 106.1를 가지키며 , 시장에 정망치인 -06% 를 넘어서
전달인 5월 달에도 -07 하락하고 있으며
Conference Board에 서 15개월 연속으로 하락 하고 있음을
발표 했습니다
2007년 2008년 경제 위기 이후 가장 긴 추세 입니다
과거 6개월 지표를 봤으때 4.2% 하락 되었으며
이전 2022년 6개월 지표는 3.8% 하락 되었습니다
앞으로 먼 미래 안에
미국에 경제 활동이 둔화 되수 있음을 예측하며
나스닥이 하락 되었습니다
Latest Press Release
Updated: Thursday, July 20, 2023
LEI for the U.S. Fell Further in June
About the Leading Economic Index and the Coincident Economic Index:
The Leading Economic Index provides an early indication of significant turning points in the business cycle and where the economy is heading in the near term. The Coincident Economic Index provides an indication of the current state of the economy. Additional details are below.
The Conference Board Leading Economic Index® (LEI) for the U.S. declined by 0.7 percent in June 2023 to 106.1 (2016=100), following a decline of 0.6 percent in May. The LEI is down 4.2 percent over the six-month period between December 2022 and June 2023—a steeper rate of decline than its 3.8 percent contraction over the previous six months (June to December 2022).
“The US LEI fell again in June, fueled by gloomier consumer expectations, weaker new orders, an increased number of initial claims for unemployment, and a reduction in housing construction,” said Justyna Zabinska-La Monica, Senior Manager, Business Cycle Indicators, at The Conference Board. “The Leading Index has been in decline for fifteen months—the longest streak of consecutive decreases since 2007-08, during the runup to the Great Recession. Taken together, June’s data suggests economic activity will continue to decelerate in the months ahead. We forecast that the US economy is likely to be in recession from Q3 2023 to Q1 2024. Elevated prices, tighter monetary policy, harder-to-get credit, and reduced government spending are poised to dampen economic growth further.”
The Conference Board Coincident Economic Index® (CEI) for the U.S. remained unchanged in June 2023 at 110.0 (2016=100), after rising by 0.2 percent in May. The CEI is now up 0.6 percent over the six-month period between December 2022 and June 2023—down from the 1.1 percent growth it recorded over the previous six months. The CEI’s component indicators—payroll employment, personal income less transfer payments, manufacturing trade and sales, and industrial production—are included among the data used to determine recessions in the US. For the past two months, industrial production has contributed negatively to the coincident index, offsetting gains from employment, sales, and income growth components.
The Conference Board Lagging Economic Index® (LAG) for the U.S. was also unchanged in June 2023, at 118.4 (2016 = 100), after improving 0.1 percent in May. The LAG is up slightly by 0.1 percent over the six-month period from December 2022 to June 2023, down dramatically from its 3.0 percent growth over the previous six months.
The annual growth rate of the LEI remained negative, signaling continued slowing in economic activity
- June Leading Indicator Index -0.7% to 106.1 vs. -0.6% consensus and -0.7% in May, The Conference Board said Thursday. The gauge has contracted for 15 months, the longest streak of consecutive decreases since 2007-'08.
- The U.S. LEI slid 4.2% in the December 2022 to June 2023 period, a steeper rate of decline than the 3.8% drop in the June to December 2022 period.
- "Taken together, June's data suggests economic activity will continue to decelerate in the months ahead," said Justyna Zabinska-La Monica, senior manager of Business Cycle Indicators at The Conference Board. "We forecast that the U.S. economy is likely to be in recession from Q3 2023 to Q1 2024. Elevated prices, tighter monetary policy, harder-to-get credit, and reduced government spending are poised to dampen economic growth further."
- Coincident Economic Index: unchanged at 110.0.
- Lagging Ecnomic Index: unchanged at 118.4.
- Earlier, the Philly Fed manufacturing index rose less than expected in July.
Most components contributed negatively to the LEI in June

Recent behavior of the US LEI continues to signal a recession ahead

Note: The chart illustrates the so-called 3D’s rule which is a reliable rule of thumb to interpret the duration, depth, and diffusion – the 3D’s – of a downward movement in the LEI. Duration refers to how long-lasting a decline in the index is, and depth denotes how large the decline is. Duration and depth are measured by the rate of change of the index over the last six months. Diffusion is a measure of how widespread the decline is (i.e., the diffusion index of the LEI ranges from 0 to 100 and numbers below 50 indicate most of the components are weakening). The 3D’s rule provides signals of impending recessions 1) when the diffusion index falls below the threshold of 50 (denoted by the black dotted line in the chart), and simultaneously 2) when the decline in the index over the most recent six months falls below the threshold of -4.2 percent. The red dotted line is drawn at the threshold value (measured by the median, -4.2 percent) on the months when both criteria are met simultaneously. Thus, the red dots signal a recession.
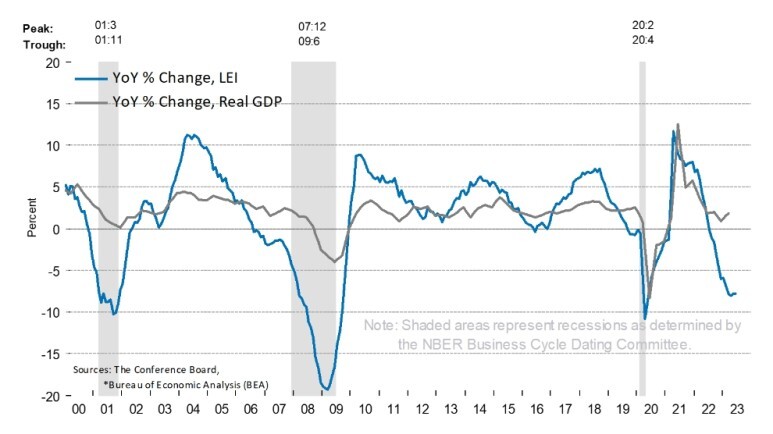
About The Conference Board Leading Economic Index® (LEI) for the U.S.: The composite economic indexes are the key elements in an analytic system designed to signal peaks and troughs in the business cycle. The indexes are constructed to summarize and reveal common turning points in the economy in a clearer and more convincing manner than any individual component. The CEI is highly correlated with real GDP. The LEI is a predictive variable that anticipates (or “leads”) turning points in the business cycle by around 7 months. Shaded areas denote recession periods or economic contractions. The dates above the shaded areas show the chronology of peaks and troughs in the business cycle.
The ten components of The Conference Board Leading Economic Index® for the U.S. include: Average weekly hours in manufacturing; Average weekly initial claims for unemployment insurance; Manufacturers’ new orders for consumer goods and materials; ISM® Index of New Orders; Manufacturers’ new orders for nondefense capital goods excluding aircraft orders; Building permits for new private housing units; S&P 500® Index of Stock Prices; Leading Credit Index™; Interest rate spread (10-year Treasury bonds less federal funds rate); Average consumer expectations for business conditions.
#미국주식#미국주식뉴스#미국주식정보#아이오벤스 생물학#유에스뱅크아메리가 #제너락#
스코츠미라클 르로우#테슬라주가#테스라주식#노보 노르디스크#제이피모건 체이스#JP모건#
스펑#제트블루항공#wd40#질로우#뉴웰브랜드#셔터스톡#
아마존#3m#주식정보#cnbc뉴스#Shutterstock#Newell Brands#Zillow#Salesforce#WD-40#
3M#Amazon#JetBlue Airways#Xpeng#JPMorgan Chase#Novo Nordisk#
Scotts Miracle-Gro#Generac#U.S. Bancorp#Iovance Biotherapeutics#
반응형


